Product carbon footprint (PCF)
Leveraging the power of carbon data for sustainable innovations in Agriculture
At Croda, sustainability isn’t just a goal—it’s at the heart of everything we do. It shapes how we operate, how we measure success, and how we lead the industry forward. By combining sustainability with innovation, we’re redefining what it means to be purposefully sustainable.


Request a PCF statement
Croda Life Sciences carbon journey infographic

Measure it to master it: harnessing biogenic carbon data for sustainable agriculture innovation
What is a Product Carbon Footprint (PCF)?
A PCF represents the total amount of greenhouse gases (GHG) released during the lifecycle of a specific product. Typically, product carbon footprints are calculated over what is termed cradle-to-gate, i.e. the emissions released to the atmosphere from the production (or extraction) and processing of raw materials to the point that they leave the factory gate.
Scope 1, 2 & 3 emissions
To help measure and assess carbon emissions, the GHG protocol categorises emissions into Scope 1, Scope 2, and Scope 3.
Carbon footprint at Croda explained: part one


Why PCF data matter?
Every product carries a carbon footprint shaped by its lifecycle. By accessing our cradle-to-gate PCFs, you gain:
- Actionable insights into ingredient-level emissions.
- Improved decision-making for sustainable design and innovation, with insights into hotspots and opportunities for carbon reduction, enabling lower-carbon formulation.
- Visibility of biogenic carbon removals, which reflect the CO₂ absorbed during biomass growth*.
- More accurate comparisons between bio-based and fossil-derived ingredients.
Biogenic carbon data reveals the true carbon impact of bio-based materials, helping you, our customers, to future-proof your portfolios and align with your customer demands for low-carbon innovations.
*Biogenic carbon data is available for over 80% of our available Croda Agriculture PCF statements.
PCF: A part of Croda’s decarbonisation journey
As the chemical and life sciences industries move to reduce their GHG emissions and decarbonise, accurate accounting of the emissions associated with products and services is needed.
To develop and direct an effective decarbonisation strategy, companies need to be able to identify areas within their operations with high total emissions and areas of high emission intensity. These hotspots are often where directed decarbonisation action can have the greatest impact towards achieving a company’s targets and supporting The Paris Agreement goal of limiting global warming to 1.5 °C.
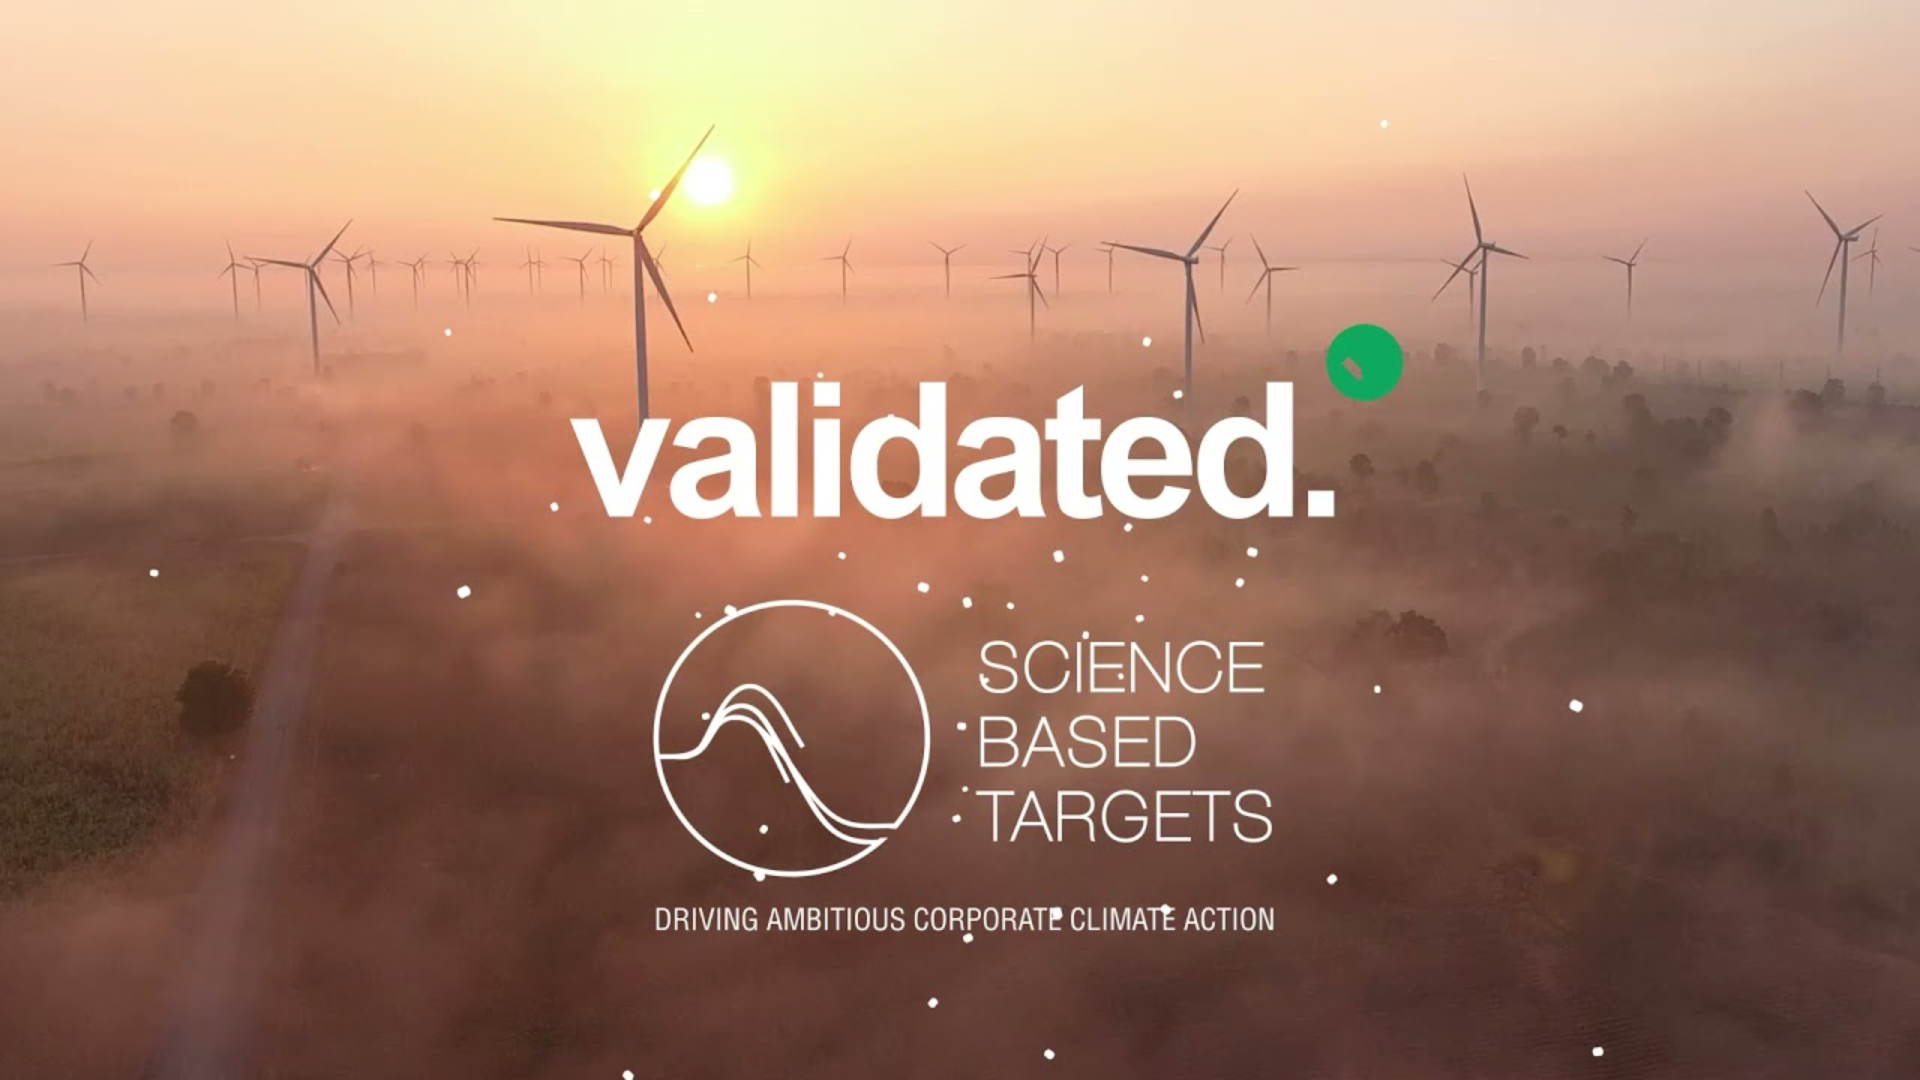
Our commitment to be Climate Positive by 2030
Our targets
Croda has now expanded the opportunities available to help its customers decarbonise by including impacts on land-related emissions, aligned with the latest understanding of climate science. SBTi has validated that Croda’s more ambitious, science-based greenhouse gas emissions reduction targets conform with the SBTi Net Zero Standard and the SBTi Forest, Land, and Agriculture Guidance.
By the end of 2030, Croda aims to:
- reduce absolute scope 1 and 2 GHG emissions by 42% – emissions from its own operations
- reduce absolute scope 3 GHG emissions by 25% – value chain emissions upstream and downstream
- reduce absolute scope 3 FLAG³ GHG emissions by 30.3% – land-related emissions upstream
- SBTi has verified our net zero science-based target by 2050.
Croda has integrated these targets into business strategies, not only reducing the environmental impact of its own operations but also helping customers advance their decarbonisation objectives.
Product Carbon Footprint: A key tool to decarbonisation
Our PCF methodology
Croda’s PCF is a cradle-to-gate life cycle assessment (LCA) (i.e. Scope 1,2 and 3 upstream). This refers to the carbon impact from the beginning of the raw material production ("cradle") to the moment it leaves our production site ("gate").
These are calculated using hybrid data (as per the GHG protocol guidance) and are aligned to Together for Sustainability (TfS) guidelines (aligned with ISO, GHG protocol, and PACT).
Croda PCFs include:
- Scope 1 emissions – direct GHG emissions from Croda’s production processes
- Scope 2 emissions – GHG emissions from the supply of energy purchased by Croda for its production processes
- Scope 3 emissions – GHG emissions for purchased raw materials
- Average data for inbound transportation, subcontracting, and waste/wastewater are also included in our PCF calculations
Croda will continue improving our data quality with more supplier-specific PCFs and LCAs for raw materials and more accurate accounting of our Scopes 1 & 2 operations.
Frequently asked questions on PCF and its uses
- Accounting for Scope 3 emissions is a significant challenge because the activities involved lie outside your organisation (and often geographical region)
- Supplier-specific data is needed to accurately estimate scope 3 emissions, identify carbon intensity hotspots, and track the impact of supply chain decarbonisation actions
--- Spend-based methods (e.g. EEIO) and averaged data can be used to estimate overall scope 3 emissions for reporting
--- Industry average LCAs (e.g. Ecoinvent) enable emission hotspots to be identified more generally
--- Only supplier-specific PCF data enables accurate scope 3 estimations, with hotspot analysis and visibility of supply chain decarbonisation actions, for purchased materials - The more primary and supplier-specific data used in a PCF calculation, the more accurate the number is likely to be
- It is important to understand the method, scope, and data quality of a PCF before assuming it accurately represents all the associated emissions
- A cradle-to-gate PCF only accounts for upstream emissions. Any in-use benefits that reduce emissions downstream should also be considered. Formulation components can optimise a product’s manufacture, storage, transport, application, or performance, all of which can affect the sustainability of a final product beyond the total PCF of its components
- Low carbon does not always mean more sustainable. More areas of environmental impact should be assessed, weighted, and compared (such as in a full LCA) to comprehensively compare the sustainability profile of different materials
- If PCFs are based on actual production data, they will always be retrospective and represent a given period (usually a calendar year or rolling average)
- They can be used to track and direct our sustainability actions and will come down overall as we continue our ambitious decarbonisation journey. However, there may be fluctuations in our PCFs as data quality improves and some may increase slightly in some years, but the trend overall will be downwards
- Our PCF data ensures that our decarbonisation actions continue to be targeted and effective. They are a part of our sustainability journey and a way to monitor our progress. We are excited to work with you as we all develop the sustainability of our supply chains
- PCFs allow Croda to identify, track and reduce our carbon emissions
- Croda PCFs are highly granular and specific to the material, manufacture site, and pack size. With granular product-level data, we can identify carbon intensity hotpots, implement improvements, monitor progress, and communicate meaningful results
- Sharing this data will support our customers in making more informed decisions as we collaborate to decarbonise our supply chains
- Send your request through our contact form and we will be in touch shortly
Sustainability is at the heart of what we do
Our commitment to sustainability continually adapts with global shifts and has consistently been a core aspect of how we do business. Sustainability permeates every facet of our operations, enhancing the value we provide to our customers. Explore the diverse manifestations of our sustainability initiatives.

Sustainability
Sustainability Impact Report 2024
